


If Bitcoin price remains range-bound, altcoins like LUNA, ATOM, CAKE and FTT could continue to move higher over the coming week.
Bitcoin (BTC) price is still range-bound and traders are searching for signs that may provide insight about the next directional move. Philip Swift, the creator of analytics resource LookIntoBitcoin, pointed out on July 9 that the Puell Multiple rebounded “out of the green zone of this week” only for the fifth time in history. Swift said if the indicator continues to move up, Bitcoin’s price may follow it higher.
Another positive outlook for Bitcoin came from Lex Moskovski, chief investment officer at Moskovski Capital, who highlighted that Bitcoin’s price was trading about 59% below the target price projected by the stock-to-flow model, which is the largest negative deflection in history. Moskovski said this could be a “great buying opportunity” for traders who believe in the model.
In other news, Capital International, a financial services company, has purchased 953,242 shares of MicroStrategy stock in the second quarter of 2021, according to the business intelligence firm’s filings to the U.S. Securities and Exchange Commission.
Due to its huge Bitcoin holding, MicroStrategy’s stock price largely follows Bitcoin’s trajectory. Therefore, the purchase by Capital International indicates that institutional investors may have started positioning for a bullish move in Bitcoin.
However, not everyone is so bullish. Guggenheim executive Scott Minerd has an extremely bearish view on Bitcoin because he anticipates a drop to $10,000.
Let’s study the charts of the top-5 cryptocurrencies and spot the critical levels that may signal the start of a strong relief rally.
BTC/USDT
Bitcoin has been trading in a tight range between $31,000 and $36,670 for the past few days, which suggests that traders are undecided about the next directional move. Usually, the breakout from a tight range results in a sharp move.
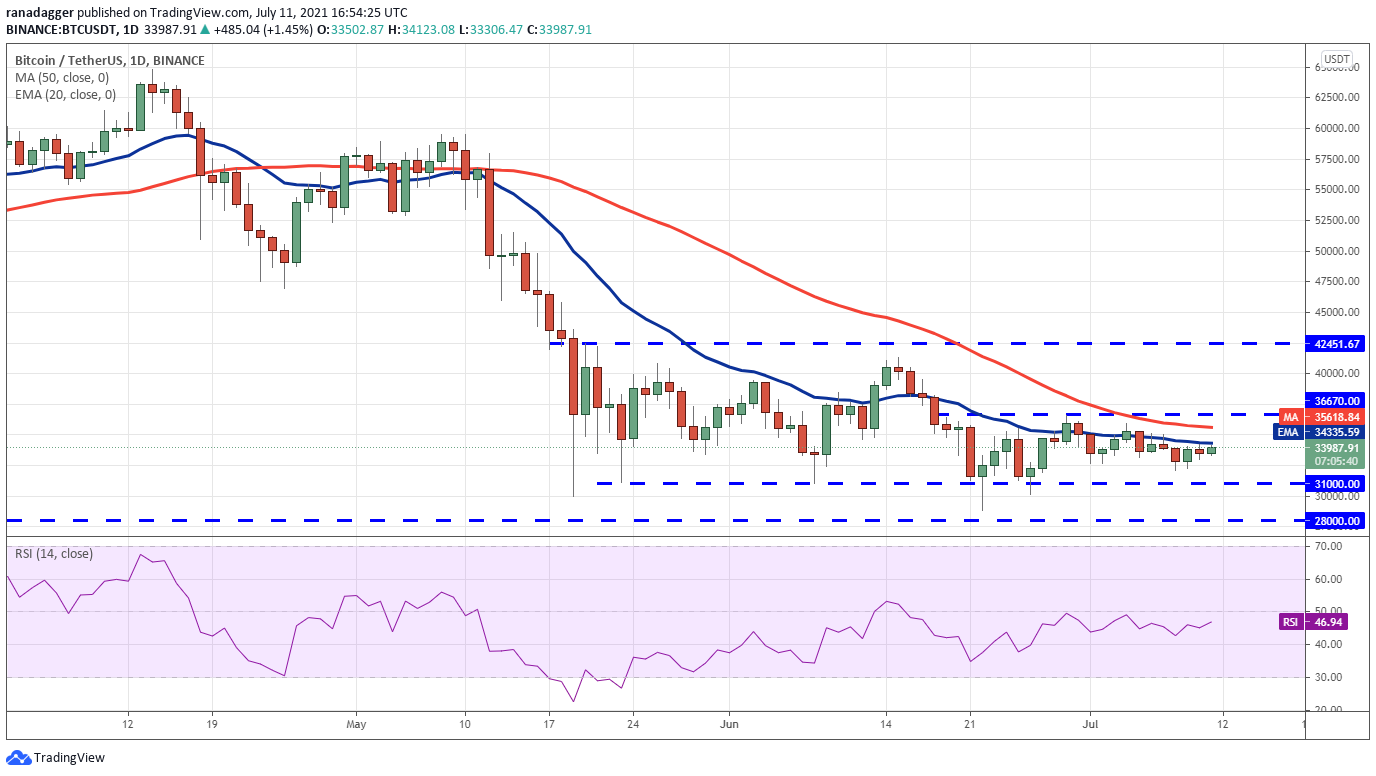
Both moving averages are gradually flattening out and the relative strength index (RSI) has been trading close to the midpoint, which suggests a balance between supply and demand. If bulls push the price above $36,670, it will be the first sign of strength.
The BTC/USDT pair could then rally to $41,330 and then to $42,451.67 where the bears are likely to mount a stiff resistance. A breakout of this resistance will indicate the possible start of a new uptrend.
On the other hand, if the price turns down from the current level or the overhead resistance at $36,670, the bears will try to pull the pair down to $31,000 and then to $28,000. A break below this support zone will increase the possibility of the resumption of the downtrend.
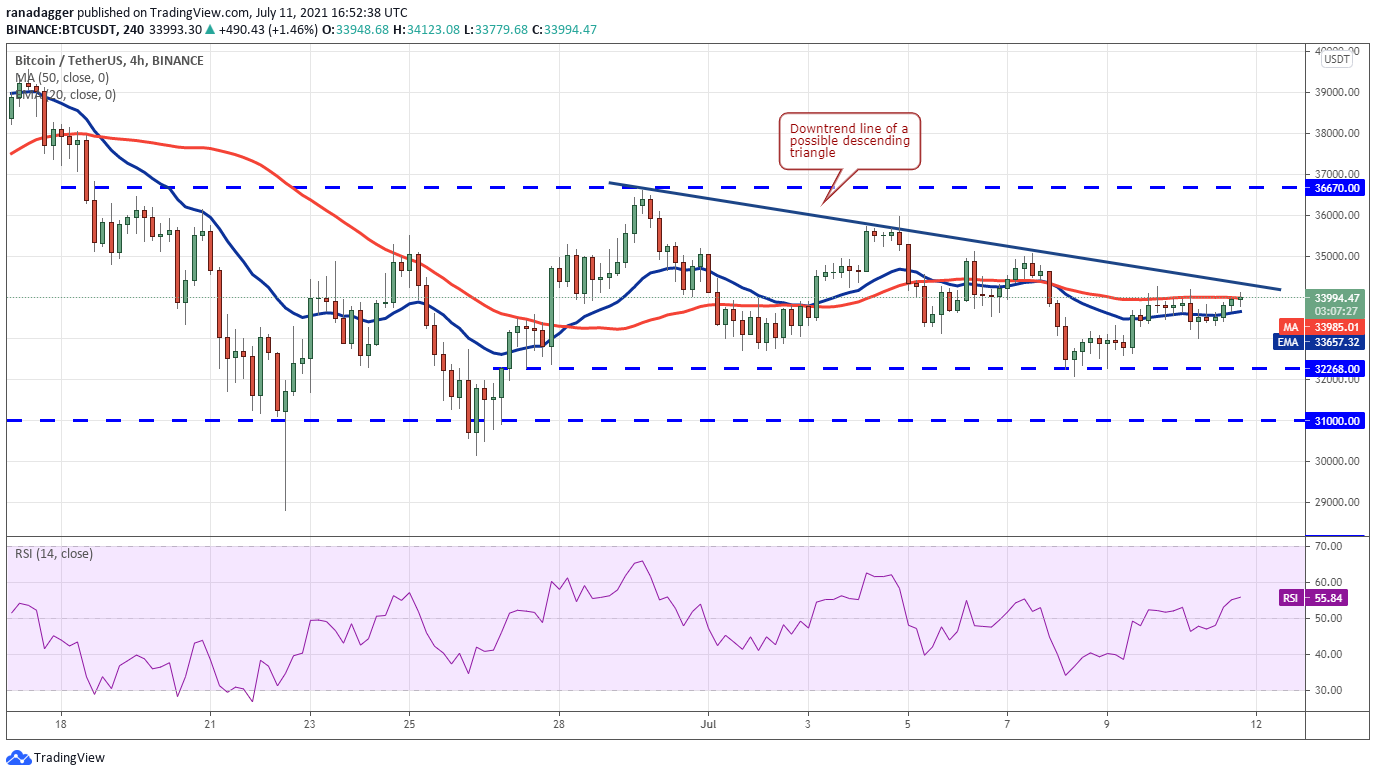
The 4-hour chart shows the formation of a descending triangle pattern that will complete on a breakdown and close below $32,268. If that happens, the possibility of a break below $31,000 increases.
On the contrary, if bulls propel the price above the downtrend line, it will invalidate the bearish setup. The failure of a negative pattern is a bullish sign as it traps the aggressive bears who have sold in anticipation of a breakdown. The pair could then rise to $36,670.
LUNA/USDT
Terra protocol’s LUNA token had been trading inside the $7.96 to $3.91 range since the end of May. However, the bulls pushed the price above the resistance on the range on July 9, indicating that demand exceeds supply.
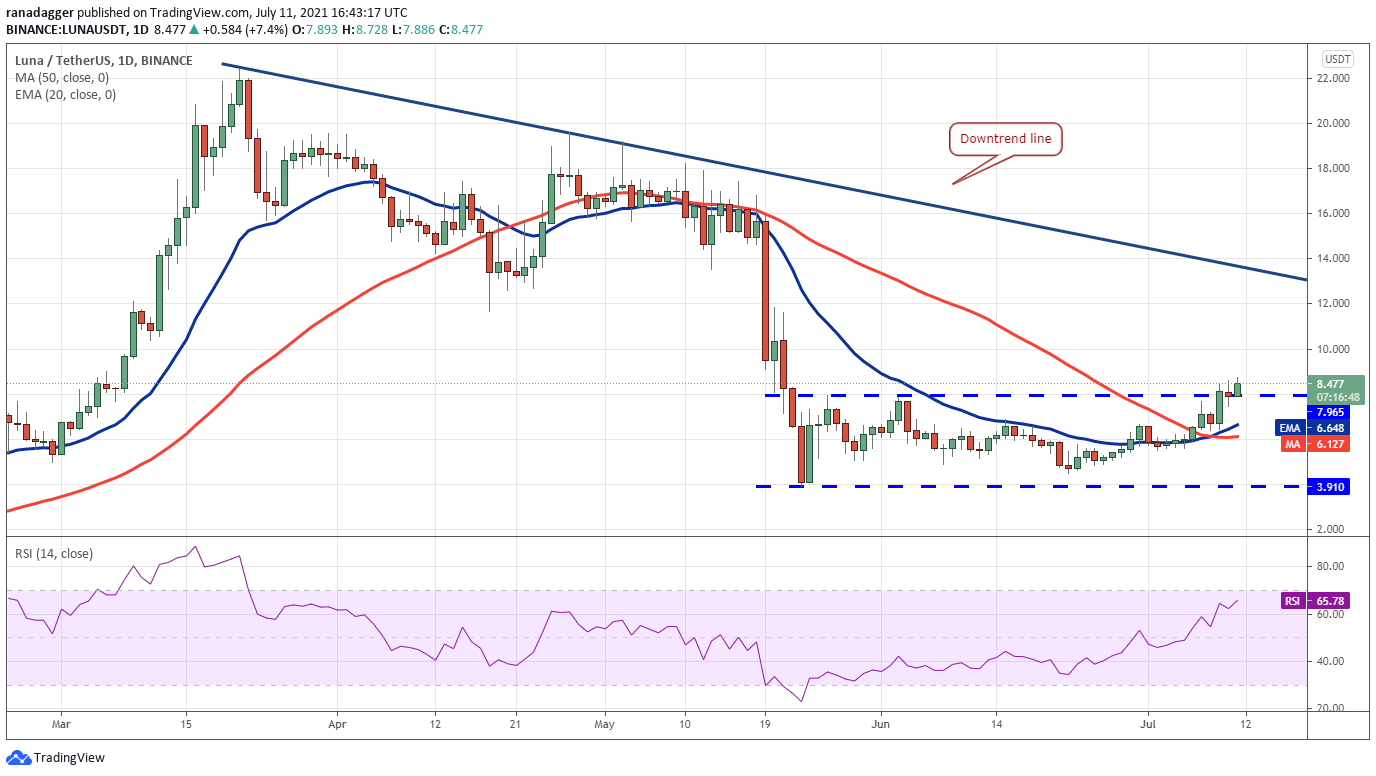
The moving averages have completed a bullish crossover and the RSI has risen close to the overbought zone, suggesting a change in trend.
If bulls sustain the price above $7.96, the LUNA/USDT pair could start a new uptrend. The first target objective on the upside is the downtrend line where the bears will again try to stall the up-move.
If the price turns down from the downtrend line but rebounds off the 20-day exponential moving average or $7.96, it will suggest the formation of a higher low. The buyers will then try to resume the uptrend by pushing the price above the downtrend line.
Contrary to this assumption, if bears pull the price back below $7.96, it will indicate a lack of demand at higher levels. A break below the moving averages will open the doors for a possible drop to $3.91.
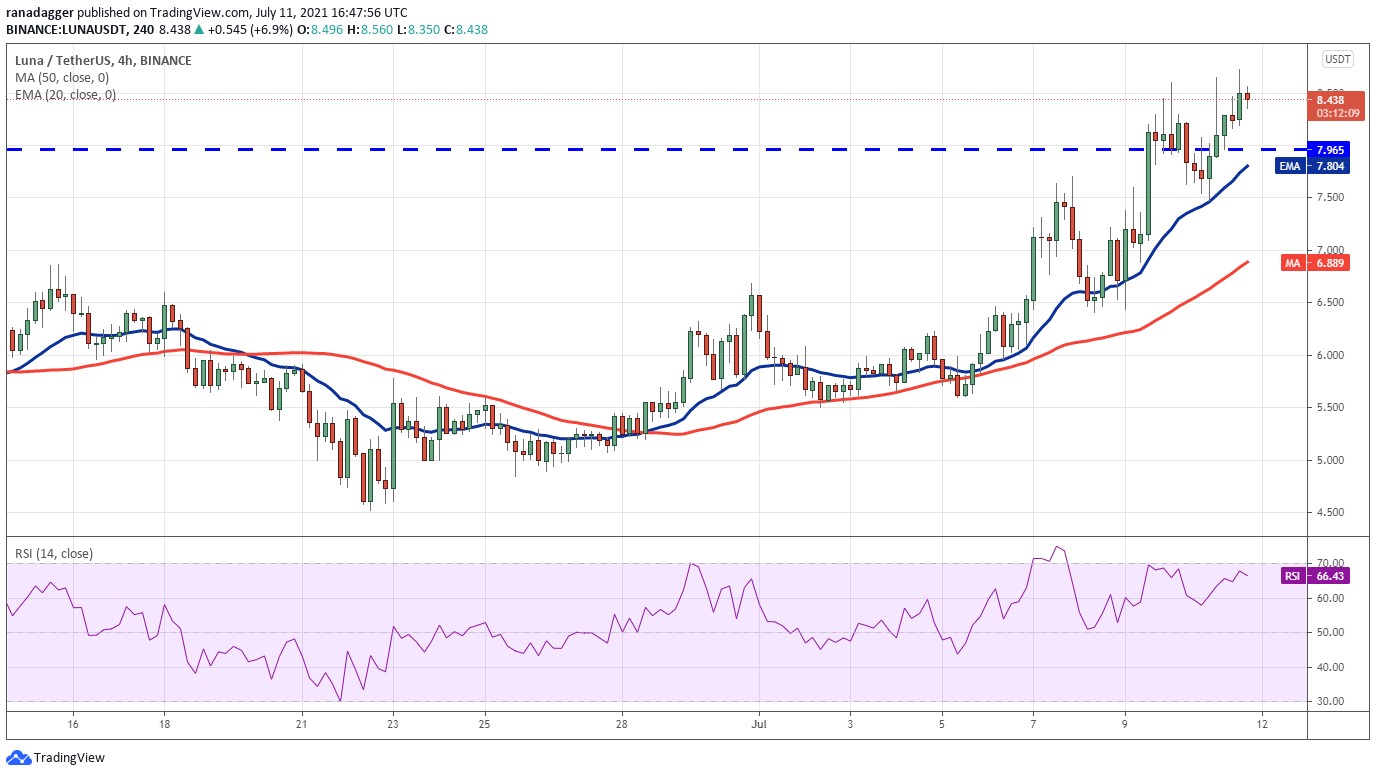
Both moving averages are sloping up and the RSI is near the overbought territory on the 4-hour chart, which shows that bulls have the upper hand.
However, the bears have not yet given up as they are trying to stall the up-move close to $8.50. If bulls drive the price above $8.75, the pair could start a new uptrend that may reach $10 and then $12.
Conversely, if the price turns down from the current level and breaks below $7.46, the pair may drop to the 50-simple moving average.
ATOM/USDT
Cosmos (ATOM) has been trading between $17.56 and $8.51 for the past few days. The bulls pushed the price above the 50-day SMA ($12.66) on July 5, which was the first sign of strength.
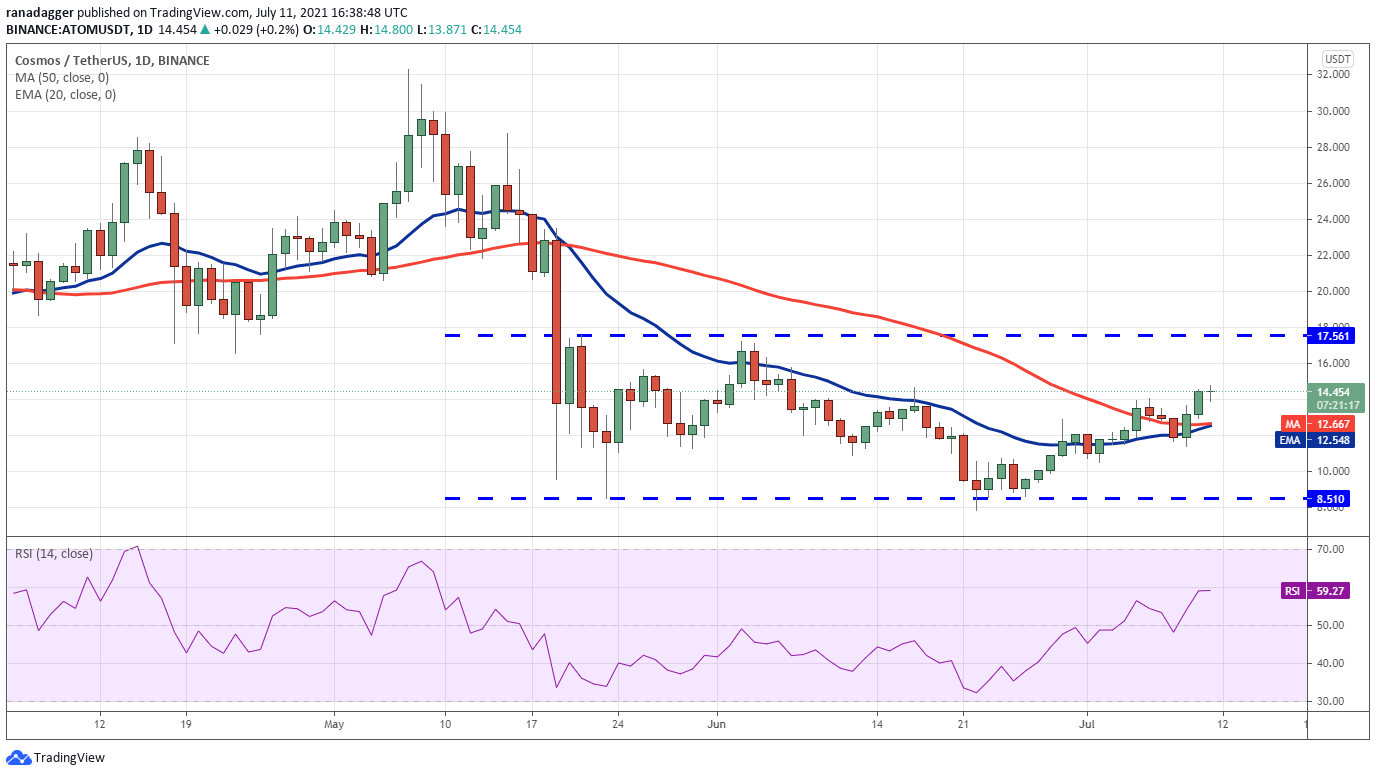
Thereafter, bears tried to trap the aggressive bulls and pull the price down but they could not break the 20-day EMA ($12.54) support. This suggests buying on dips.
The moving averages are on the verge of a bullish crossover and the RSI is in the positive territory, which suggests that the correction may have ended. The bulls will now try to push the price to the resistance of the range at $17.56 where the bears are likely to pose a stiff challenge.
This bullish view will be negated if the price turns down from the current level and the bears sink the ATOM/USDT pair below $11.41. Such a move could open the doors for a drop to the critical support at $8.51.
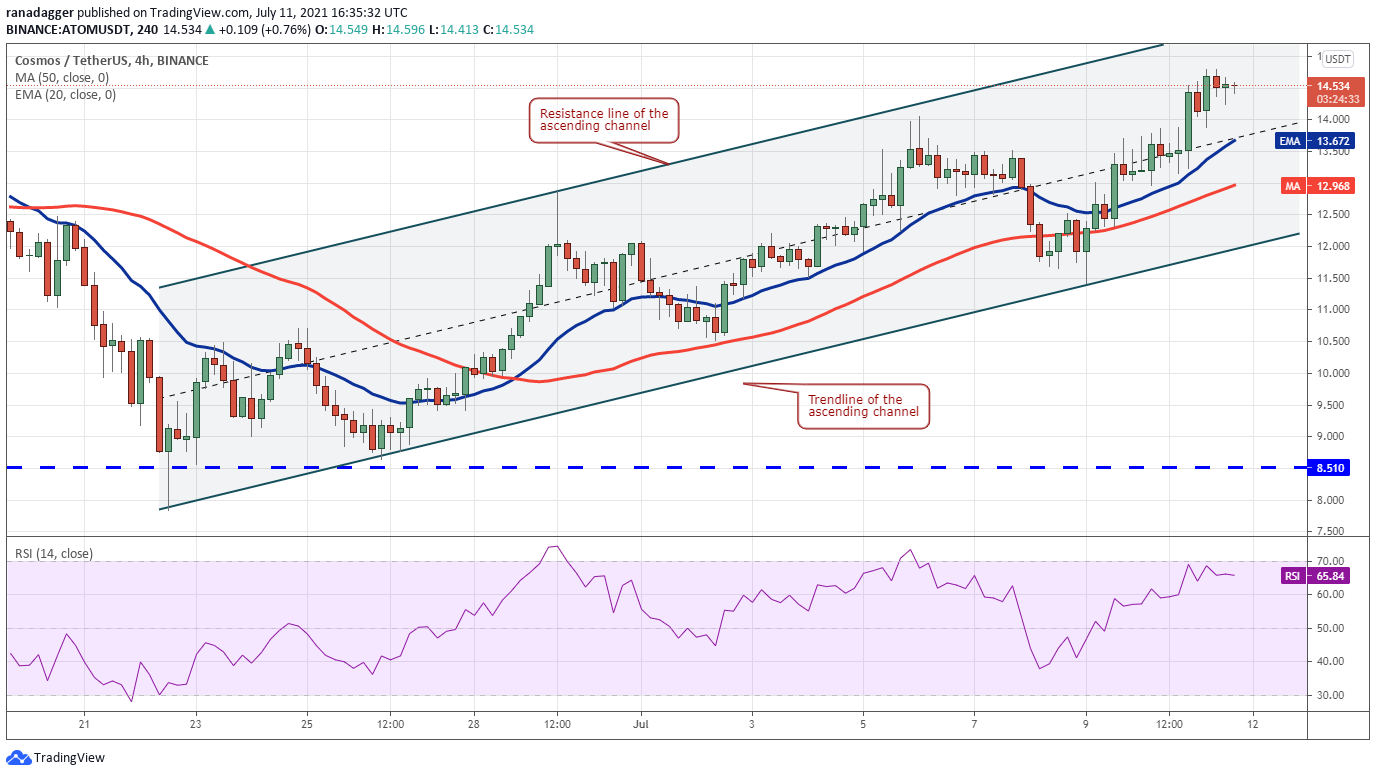
The price has been trading inside an ascending channel for the past few days. Both moving averages are sloping up and the RSI is in the positive zone, indicating the path of least resistance is to the upside.
If the price rebounds off the 20-EMA, the bulls will try to break the pair above the resistance line of the channel. If they succeed, the pair could pick up momentum and rally to $17.56.
On the contrary, if bears sink the price below the moving averages, the pair could drop to the trendline of the channel. A break below this support will shift the advantage in favor of the bears.
CAKE/USDT
PancakeSwap (CAKE) has been sandwiched between the moving averages for the past five days. This consolidation shows that bears are defending the 50-day SMA ($15.67) while the bulls are buying the dips to the 20-day EMA ($14.55).
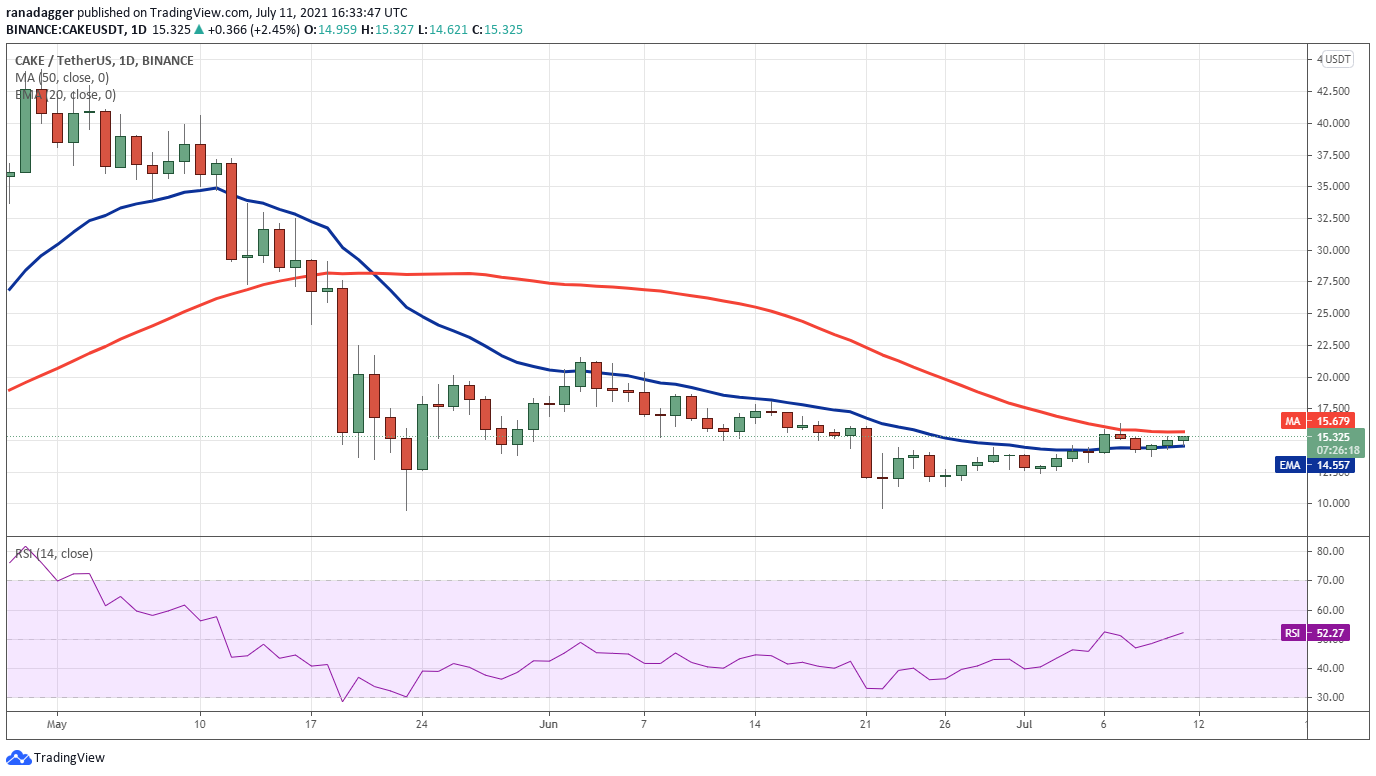
However, this tight range trading is unlikely to continue for long and may result in a strong move within the next few days. The RSI has risen into the positive territory, indicating that bulls have a minor advantage.
If buyers push and sustain the price above the 50-day SMA, the CAKE/USDT pair could rally to $18.62 and later to $21.52.
Alternatively, if the price turns down and plummets below the 20-day EMA, the bears might pull the price down to $12.39. A break below this support could open the doors for a retest of the critical support at $10.
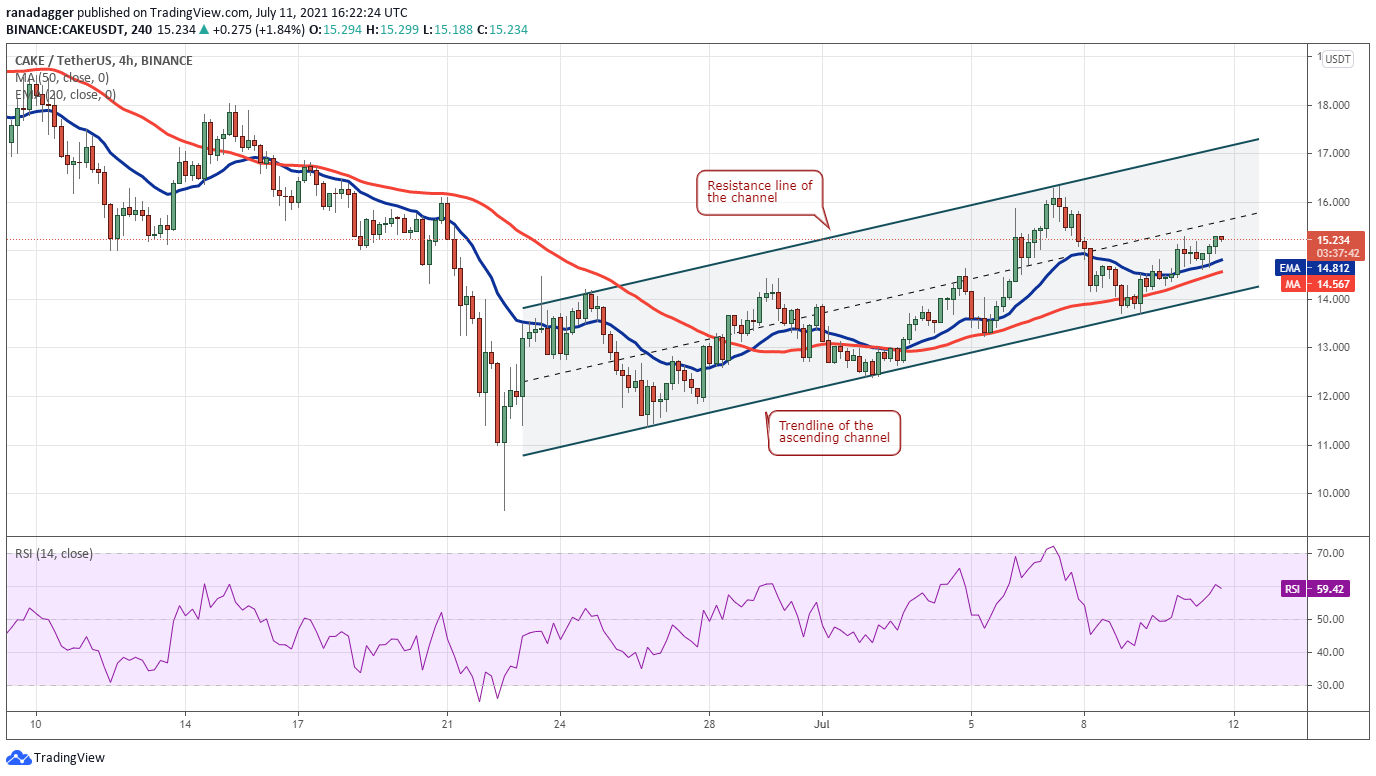
The 4-hour chart shows that the price is rising inside an ascending channel. Both moving averages are sloping up gradually and the RSI is in the positive zone, suggesting that buyers have the upper hand.
The bulls will now try to push the price into the upper half of the channel. If they succeed, the pair could rise to the resistance line of the channel near $17. Contrary to this assumption, if the price turns down and breaks below the trendline of the channel, it will suggest an end of the short-term up-move.
Related: Key altcoin price metric flashed bullish ahead of Axie Infinity’s parabolic rally
FTT/USDT
FTX Token (FTT) broke above the downtrend line on July 6, suggesting that the correction may have ended. The bears tried to stall the recovery at the 50-day SMA ($30.26) on July 8 but could not sink the price below the 20-day EMA ($28.68).
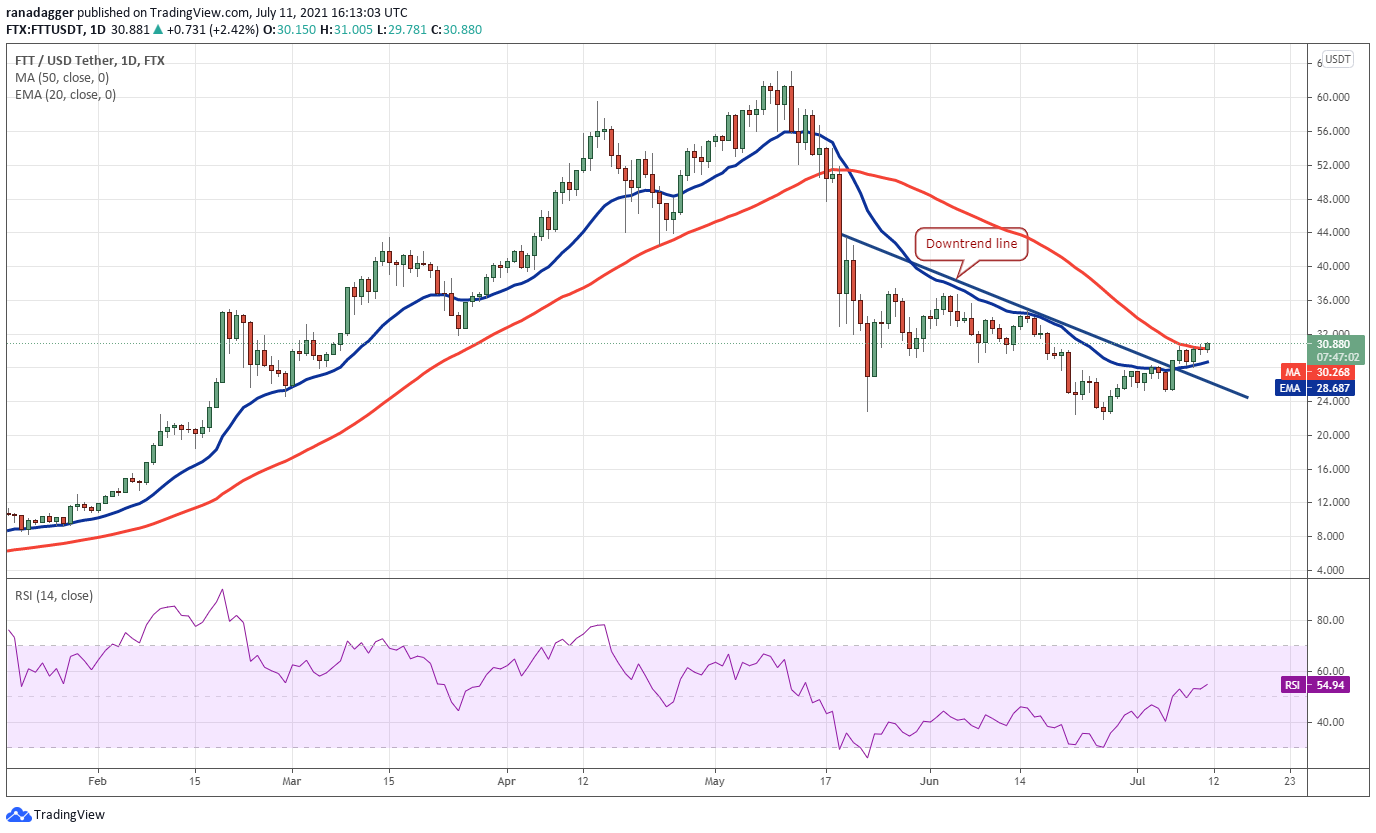
The price rebounded off the 20-day EMA on July 9 and the bulls are trying to push the FTT/USDT pair above the 50-day SMA. The 20-day EMA has started to turn up marginally and the RSI has risen into the positive zone, indicating that bulls are attempting to make a comeback.
If buyers propel and sustain the price above the 50-day SMA, the pair could start a relief rally that may reach $34.73 and then $36.73.
This bullish view will invalidate if the price turns down from the current level and plummets below the 20-day EMA. Such a move will suggest that bears are selling on rallies. The pair could then drop to the next support at $25.22.
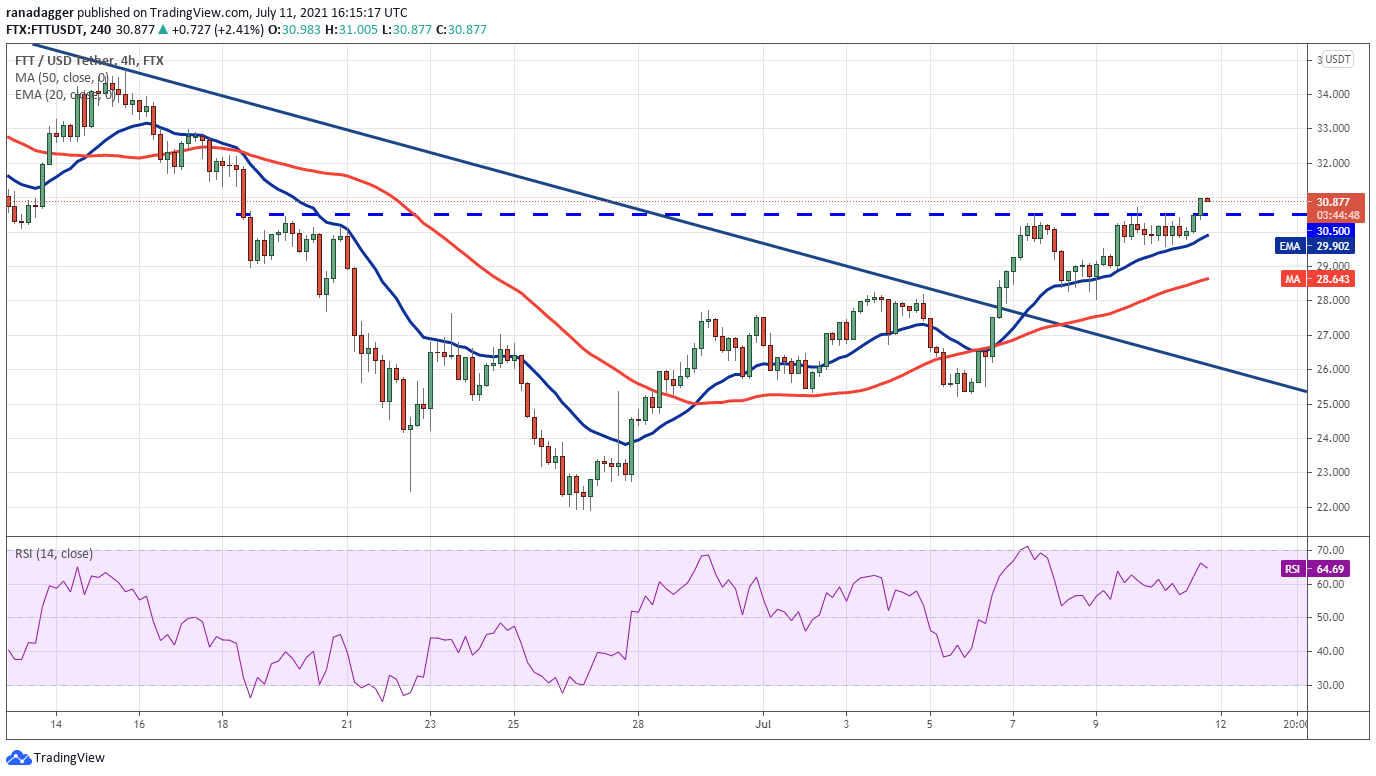
The 4-hour chart shows that bulls have pushed the price above the overhead resistance at $30.50. The rising moving averages and the RSI in the positive territory suggest the path of least resistance is to the upside.
If buyers sustain the price above $30.50, the pair could extend its relief rally to $33 and then to $34.73. This positive view will be invalidated if the price turns down from the current level and breaks below $29.50. Such a move could pull the pair down to $28.
The views and opinions expressed here are solely those of the author and do not necessarily reflect the views of Cointelegraph. Every investment and trading move involves risk, you should conduct your own research when making a decision.


 Value Crash; Coincidence?")
