


In an astonishing move, Bitcoin’s price has surged past the $47,000 mark, a feat that has caught the attention of investors and analysts alike. This significant price movement can be attributed to three key factors: the influx of investments into spot Bitcoin exchange-traded funds (ETFs), notable activities in the futures market, and a technical breakout from a period of compression. Here’s an in-depth look at each of these contributing elements.
#1 Bitcoin ETFs See Record Inflows
The market observed a remarkable influx of $403 million into spot Bitcoin ETFs on February 8, signifying the third-largest single-day net inflow despite a withdrawal of over $101.6 million from the Grayscale Bitcoin Trust (GBTC). Since the launch of these ETFs on January 11, the total inflow has surpassed $2.1 billion (more than 200,000 BTC), demonstrating a burgeoning appetite for Bitcoin amongst investors.
Eric Balchunas, a renowned Bloomberg ETF expert, offered insights via X into the unparalleled success of these financial products. He stated, “After just one month on the market, [BlackRock’s] IBIT and [Fidelity’s] FBTC stand out among the Top 25 ETFs by assets, with over $3 billion each.”
Balchunas further elaborated on the competitive dynamics at play, suggesting, “The real unseen force here is competition. The launch of 10 ETFs on the same day, featuring some heavyweight issuers, truly spurred a hustle for inflows, showcasing an aggressive pursuit of market share.”
#2 Futures Market Dynamics And Short Liquidation
The futures market for Bitcoin has witnessed a notable short liquidation event, with total liquidations reaching $52.09 million in the past 24 hours, according to data from Glassnode. This event was highlighted by the largest single liquidation order on Bitmex (XBTUSD), valued at $5.11 million.
Crypto analyst Skew commented on the situation, noting, “I’d say majority or a decent portion of the revenge shorts fading the grind higher were squeezed out above $45K into current price area. Spot flows even more significant here especially with longs starting to chase price. Note decreasing perp discounts more towards potential premiums in the future, if another squeeze higher occurs with high perp premiums & spot selling that would likely be the local high of this rally.”
Vetle Lunde, a Senior Analyst at K33 Research, observed a recovery in the CME basis back to levels seen prior to the ETF influx, with a noteworthy increase in open interest. “CME basis has recovered to pre-ETF levels of 15%. Open interest has surged higher amidst the recovery, growing by 15.6k BTC (16%) in the past 3 days. Virtually all growth stems from active market participants – non-ETFs. The OI among this cohort has recovered to pre ETF levels,” Lunde remarked.

#3 Technical Breakout Indicated By The BBW
A crucial signal for the recent price movement was provided by the Bollinger Band Width (BBW) indicator, which identified a breakout from a period of compression. The BBW fell as low as 0.11, indicating a period of low volatility and an imminent ‘squeeze.’
At press time, BTC traded at $47,359.
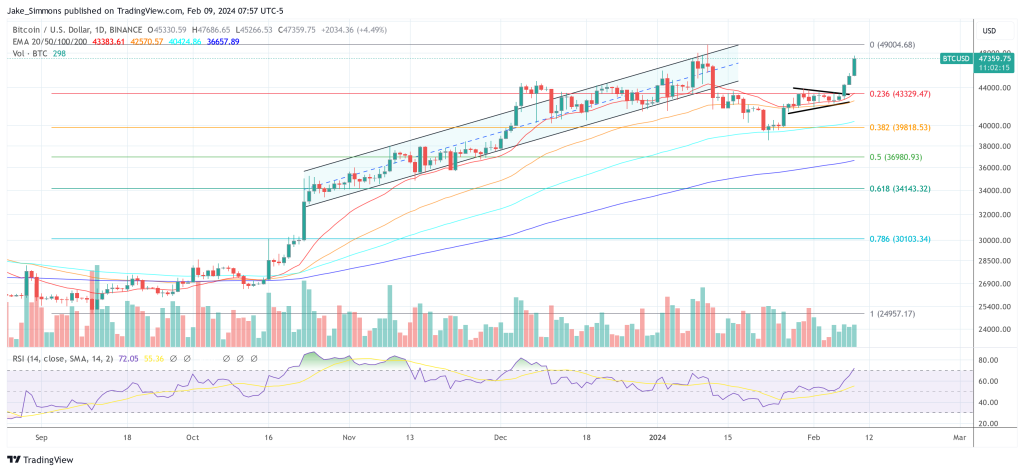
Featured image created with DALLE, chart from TradingView.com


