


Bitcoin price started a strong increase above the $42,000 zone. BTC is now consolidating gains and might rally further toward the $45,000 zone.
- Bitcoin gained pace above the $42,200 and $43,200 levels.
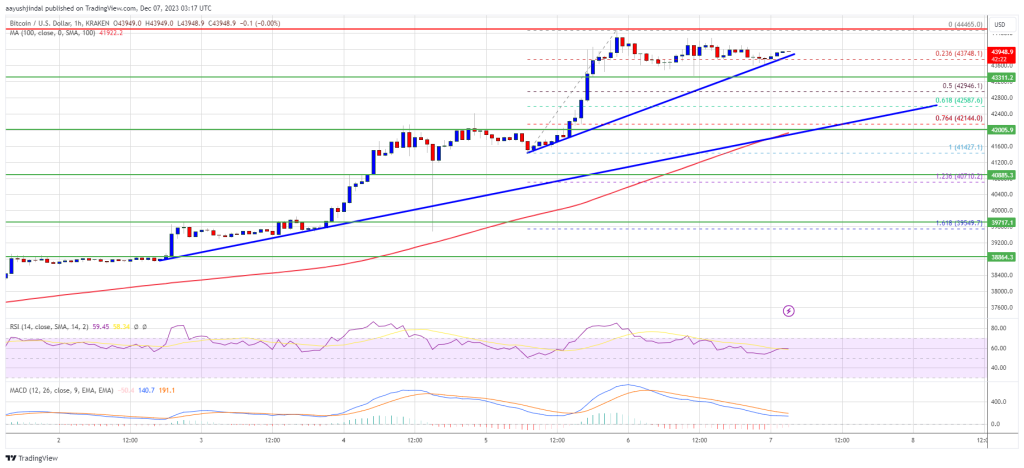
- The price is trading above $43,000 and the 100 hourly Simple moving average.
- There are two bullish trend lines forming with support near $43,900 and $42,000 on the hourly chart of the BTC/USD pair (data feed from Kraken).
- The pair is likely setting up for a fresh increase above the $44,000 level.
Bitcoin Price Remains Supported
Bitcoin price started a major increase above the $42,000 resistance zone. BTC surged and even broke the $43,200 resistance zone. A new multi-month high was formed near $44,465 before the price started a minor downside correction.
There was a move below the $44,000 level. The price tested the 23.6% Fib retracement level of the upward move from the $39,475 swing low to the $44,465 high. However, the bulls remained active above the $43,200 support zone.
Bitcoin also trades above $43,500 and the 100 hourly Simple moving average. Besides, there are two bullish trend lines forming with support near $43,900 and $42,000 on the hourly chart of the BTC/USD pair. The second trend line is close to the 61.8% Fib retracement level of the upward move from the $39,475 swing low to the $44,465 high.
On the upside, immediate resistance is near the $44,250 level. The first major resistance is forming near $44,450, above which the price might rally toward the $45,000 level.
Source: BTCUSD on TradingView.com
A close above the $45,000 resistance might send the price further higher. The next key resistance could be near $46,200, above which BTC could rise toward the $47,500 level.
Short-term Dips In BTC?
If Bitcoin fails to rise above the $44,250 resistance zone, it could start a downside correction. Immediate support on the downside is near the $43,900 level and the trend line.
The next major support is near $42,550, below which the price might test the second trend line. If there is a move below $42,000, there is a risk of more downsides. In the stated case, the price could drop toward the $41,200 support in the near term.
Technical indicators:
Hourly MACD – The MACD is now gaining pace in the bullish zone.
Hourly RSI (Relative Strength Index) – The RSI for BTC/USD is now above the 50 level.
Major Support Levels – $43,900, followed by $42,000.
Major Resistance Levels – $44,250, $44,450, and $45,000.


 Ought to Not Thoughts Altcoins: Ari Paul")