


Ethereum price is correcting gains from the $2,320 resistance zone. ETH is moving lower and might even test $2,050 before the bulls take a stand.
- Ethereum is correcting gains below the $2,250 support zone.
- The price is trading below $2,240 and the 100-hourly Simple Moving Average.
- There are two bearish trend lines forming with resistance near $2,230 and $2,260 on the hourly chart of ETH/USD (data feed via Kraken).
- The pair could extend its decline and revisit the $2,050 support zone.
Ethereum Price Extends Losses
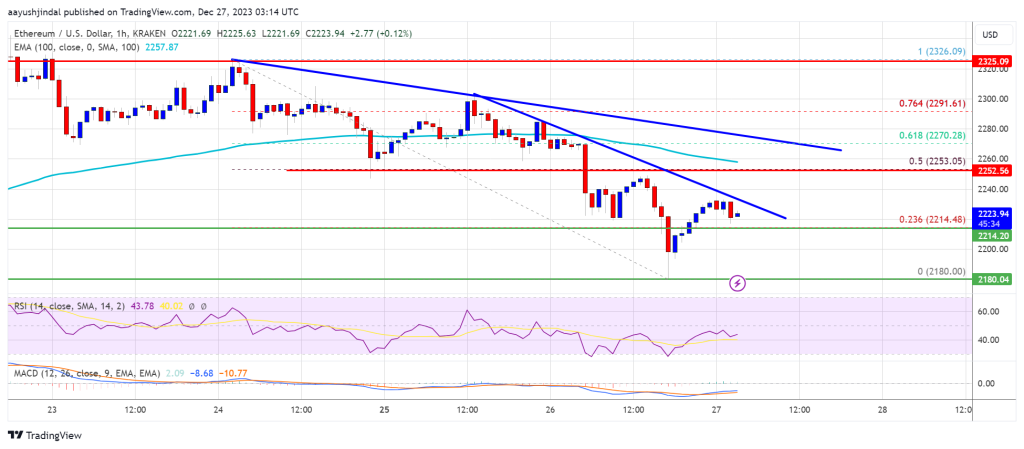
Ethereum price started a downside correction from the $2,325 level. ETH declined below the $2,300 and $2,265 levels. The bears were even able to push the pair below the $2,200 level, like Bitcoin.
A low was formed near $2,180 and the price is now attempting a fresh increase. There was a move above the $2,200 level. The price climbed above the 23.6% Fib retracement level of the downward move from the $2,326 swing high to the $2,180 low.
Ethereum is now trading below $2,240 and the 100-hourly Simple Moving Average. On the upside, the price is facing resistance near the $2,230 level. There are two bearish trend lines forming with resistance near $2,230 and $2,260 on the hourly chart of ETH/USD.
The second trend line is close to the 50% Fib retracement level of the downward move from the $2,326 swing high to the $2,180 low. A close above the $2,260 resistance could send the price toward $2,325.
Source: ETHUSD on TradingView.com
The main resistance sits at $2,350. A clear move above the $2,350 zone could start a decent increase. The next resistance sits at $2,420, above which Ethereum might rally and test the $2,500 zone.
More Downsides in ETH?
If Ethereum fails to clear the $2,260 resistance, it could start a fresh decline. Initial support on the downside is near the $2,200 level.
The first key support could be the $2,180 zone. A downside break and a close below $2,180 might spark more bearish moves. In the stated case, Ether could revisit the $2,120 support. Any more losses might send the price toward the $2,050 level.
Technical Indicators
Hourly MACD – The MACD for ETH/USD is losing momentum in the bearish zone.
Hourly RSI – The RSI for ETH/USD is now below the 50 level.
Major Support Level – $2,180
Major Resistance Level – $2,260
Disclaimer: The article is provided for educational purposes only. It does not represent the opinions of NewsBTC on whether to buy, sell or hold any investments and naturally investing carries risks. You are advised to conduct your own research before making any investment decisions. Use information provided on this website entirely at your own risk.


