


Ethereum price struggled above $2,100. ETH is now moving lower and might continue to drop toward the $1,930 support in the near term.
- Ethereum is consolidating and facing resistance near the $2,060 zone.
- The price is trading below $2,080 and the 100-hourly Simple Moving Average.
- There is a key bearish trend line forming with resistance near $2,065 on the hourly chart of ETH/USD (data feed via Kraken).
- The pair could continue to move down if it breaks the $2,035 support zone.
Ethereum Price Drops Again
Ethereum price attempted a fresh increase above the $2,080 resistance zone. ETH even spiked above the $2,120 resistance zone, like Bitcoin. However, the bears were active above $2,120.
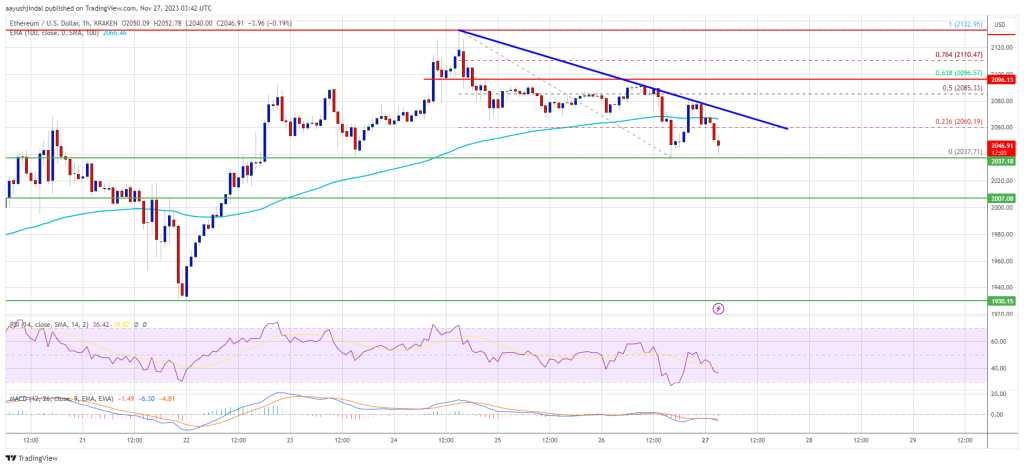
A high was formed near $2,132 before the price started a fresh decline. There was a move below the $2,080 level. A low is formed near $2,037 and the price is now consolidating losses. It is struggling below the 23.6% Fib retracement level of the recent decline from the $2,132 swing high to the $2,037 low.
Ethereum is now trading below $2,080 and the 100-hourly Simple Moving Average. On the upside, the price is facing resistance near the $2,065 zone. There is also a key bearish trend line forming with resistance near $2,065 on the hourly chart of ETH/USD.
The first key resistance is near the $2,100 level or the 61.8% Fib retracement level of the recent decline from the $2,132 swing high to the $2,037 low. A clear move above the $2,100 level could send the price toward the $2,120 resistance zone.
Source: ETHUSD on TradingView.com
The next resistance is near $2,135, above which the price could aim for a move toward the $2,200 level. Any more gains could start a wave toward the $2,250 level.
More Losses in ETH?
If Ethereum fails to clear the $2,080 resistance, it could start a fresh decline. Initial support on the downside is near the $2,035 level.
The next key support is $2,000. A downside break below $2,000 might send Ether toward the $1,930 support. The key support is now at $1,900, below which there is a risk of a move toward the $1,840 level.
Technical Indicators
Hourly MACD – The MACD for ETH/USD is losing momentum in the bullish zone.
Hourly RSI – The RSI for ETH/USD is now below the 50 level.
Major Support Level – $2,035
Major Resistance Level – $2,080


