


The Binance Coin (BNB) price is crucial as market analysts offer differing viewpoints on the cryptocurrency’s potential direction. While one analyst presents a bullish case, anticipating a breakout and surge beyond $300, another raises concerns about a dip below $200.
BNB Price Analysis
Crypto analyst Ali Martinez suggests that BNB price could be on the verge of breaking out of a head-and-shoulders pattern.
Martinez emphasizes the significance of a sustained close above $261, which could catalyze BNB’s upward trajectory toward $310. With a 2.9% gain over the past 24 hours and a 12% uptrend in the last fourteen days, the recent price action aligns with Martinez’s breakout thesis.
Martinez analyzes the 1-day chart and identifies the $257 level as a crucial breakout point, signaling a potential shift in trend.
If the sustained uptrend continues, BNB’s price could see a substantial 19.8% gain shortly, pushing the price toward $310. This projection remains just below BNB’s yearly high of $350 in April.
However, contrasting this bullish outlook, Daan de Rover, a crypto analyst, and YouTuber, highlights BNB’s downtrend structure in the 1-week chart.
Bearish Outlook For Binance Coin
According to de Rover, the current BNB price action “looks weak,” raising concerns about the currency’s possible continuation of its downward trajectory, which began earlier this year.
The analyst points to the “green box” on the 1-week chart, as seen in the graphic below, as a critical support level. If breached, it could lead to a deeper decline for BNB, falling below the $200 mark.
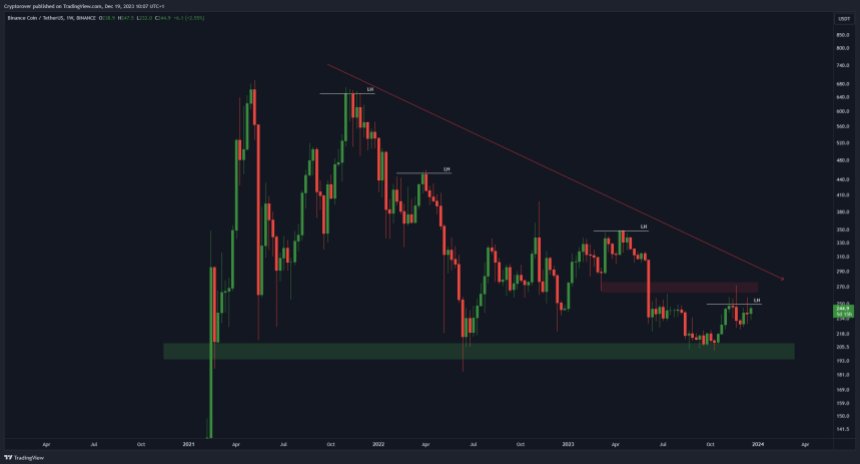
De Rover’s cautious view is further emphasized by the fact that dropping below $200 would mark a level not breached since the bear market and crypto winter.
BNB Chain Records Positive Growth
According to Token Terminal data, the circulating market cap of BNB stands at $39.83 billion, with a slight decrease of 1.56% observed. However, it is important to note that the fully diluted market cap remains the same at $39.83 billion, indicating a stable valuation for the cryptocurrency.
BNB has witnessed a positive revenue trend, with a 30.37% increase in annualized revenue, reaching $16.46 million. The 30-day revenue figure also shows growth at $1.35 million, representing a 21.33% increase.
When assessing profitability ratios, the price-to-fully-diluted ratio (P/F) currently stands at 281.75x, indicating the market’s confidence in BNB’s potential. While there has been a slight decline of 18.2% in this ratio, it remains relatively high.
The price-to-sales ratio (P/S) is also noteworthy, reaching 2,962.98x, although it has experienced a decline of 18.5%.
BNB Chain has seen a positive trend regarding fees generated, with a 30-day increase of 20.92% to $14.22 million. The annualized fees have grown substantially, reaching $173.07 million, a significant 30.15% increase.
The future trajectory of the BNB price and its underlying blockchain remains uncertain. Whether the cryptocurrency will experience continued growth or succumb to a bearish sentiment is yet to be determined.
Featured image from Shutterstock, chart from TradingView.com
Disclaimer: The article is provided for educational purposes only. It does not represent the opinions of NewsBTC on whether to buy, sell or hold any investments and naturally investing carries risks. You are advised to conduct your own research before making any investment decisions. Use information provided on this website entirely at your own risk.


 Falters Pushing Bitcoin Dominance Index to 2019 Excessive")
 Settle for ‘Virtual Currency’")