


Renowned cryptocurrency analyst Dark Defender, with a substantial following of nearly 100,000 individuals on platform X, has drawn attention to the emergence of a “cup and handle pattern” in the daily time frame of the cryptocurrency XRP.
Based on his analysis, provided that the token maintains a closing price above the support level of $0.604, XRP has potential for a positive upswing towards the price goals of $1.05 and $1.88.
Although Dark Defender’s projection has all the bullish elements to give XRP some badly needed boost in price, another analyst’s estimation also provides a great deal of importance.
Hi all. $XRP formed a cup & handle pattern in the daily time frame.
We set targets for $1.05 & $1.88 with the Elliott Waves, and now the Cup-Handle pattern is also blinking XRP to reach the targets.
Can the handle be extended towards $0.5286 Support?
We still need to close… pic.twitter.com/SvVokOYTs8
— Dark Defender (@DefendDark) November 21, 2023
XRP Upward Trend And Institutional Investments
In a world where predictions are often uncertain, the assurance made by prominent cryptocurrency analyst EGRAG provides another straightforward perspective, suggesting that the journey to a $40 XRP might be less complicated than skeptics think.
The price of XRP remained over the $0.60 threshold during the early hours of Tuesday. The alternative cryptocurrency is currently seeing an upward trend, accompanied by an increase in the amount of capital being invested by institutional investors into XRP funds.
#XRP – Once you spot it, you’re hooked!
The FOMO’s about to hit hard at $2! 💥
My bank account? It’s #XRP all the way! Every gain feeds back into #XRP. 💰#XRPArmy STAY STEADY, The #XRP TA indicate to an incredibly bullish long-term outlook. 🐂 pic.twitter.com/z3PuhvwCmn
— EGRAG CRYPTO (@egragcrypto) November 22, 2023
In recent weeks, there has been a notable trend of significant wallet investors divesting their XRP token holdings, while retail traders have concurrently demonstrated an inclination towards acquiring the altcoin. This phenomenon has contributed to the development of a positive outlook for XRP.
The price of XRP is currently $0.6105, 1.8% less than it was a day ago. Despite the continued downturn, interest in the asset is increasing; transaction volume has increased by 25% in the past day to around $1.2 billion.
Total crypto market cap is currently at $1.39 trillion. Chart: TradingView.com
Implications Of The Ascending Triangle For XRP’s Future
One of his most recent updates on XRP, where he drew attention to the asset’s moves on the weekly chart, demonstrates his ongoing bullishness. XRP is presently trading inside an ascending triangle that has been there since 2018, according to EGRAG’s chart.
An ascending triangle is a bullish pattern in technical analysis, formed by a horizontal resistance line and a rising support trendline. It indicates a market where buyers are consistently pushing the price higher against a specific resistance level.
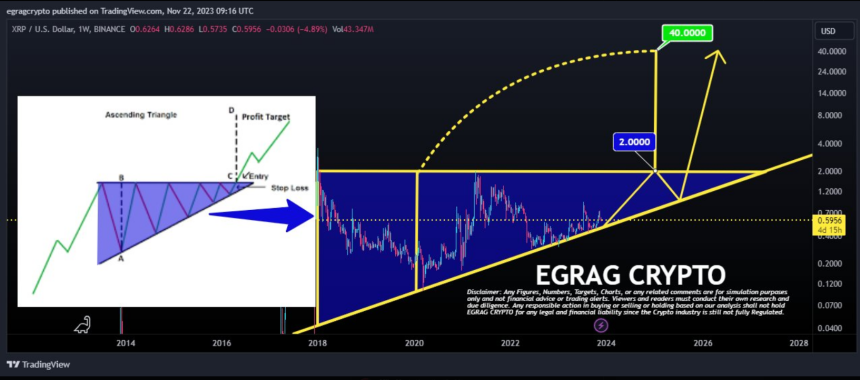
Traders anticipate a potential upward breakout at the triangle’s apex, signaling a continuation of the existing uptrend. This pattern is often seen as a sign of increasing buying pressure.
(This site’s content should not be construed as investment advice. Investing involves risk. When you invest, your capital is subject to risk).
Featured image from Pexels


