


Bitcoin has seen a rebound back above the $43,000 level during the past day. Here’s a possible reason behind this reversal in the asset.
Bitcoin Has Rebounded Back Towards The $43,000 Mark
Just earlier, Bitcoin had plunged to a low of $40,500 as the market had witnessed some significant selling pressure. In the past day, however, BTC has already turned itself around, as it has recovered back above the $43,000 level.
The below chart shows the rollercoaster the cryptocurrency has gone through in the last few days:
Looks like the price of the asset has sharply surged during the past 24 hours | Source: BTCUSD on TradingView
As is usually the case, the other assets in the sector have also followed in the original cryptocurrency’s lead and turned themselves around, seeing surges of their own.
Due to this sharp market-wide surge, the futures side has seen a large amount of liquidations, as the below table displays:
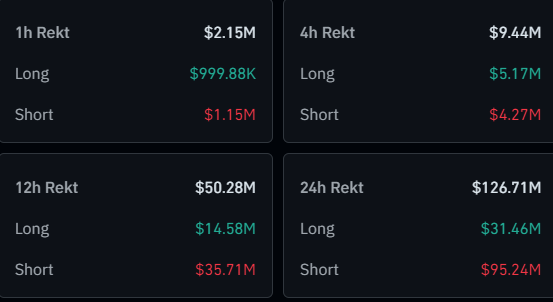
The total amount of futures liquidations in the last 24 hours | Source: CoinGlass
Shorts have naturally taken the majority of the hit in this mass cryptocurrency liquidation event, as $95 million of the $126 million total has come from contract holders of this type. Bitcoin shorts alone have contributed about $41 million to these liquidations.
Now, what’s the cause behind this sudden revival in the market? Data shared by the on-chain analytics firm Santiment could perhaps provide some hints about it.
Cryptocurrency Traders Showed Deeply Negative Sentiment Before The Rebound
As explained by Santiment in a new post on X, cryptocurrency traders have shown fear on social media during the last few days. The indicator of interest here is the “Weighted Sentiment,” which itself is based on two other metrics called the Sentiment Score and Social Volume.
The Sentiment Score measures the sentiment shared by the majority of the traders on the major social media platforms. To separate between the positive and negative sentiments, the metric makes use of a machine learning model trained by the analytics firm.
The other relevant indicator here, the “Social Volume” keeps track of the total amount of discussion a particular topic is receiving on the major social media platforms.
Now, what the Weighted Sentiment does is that it takes the Sentiment Score and weighs it against the Social Volume. This means that the metric’s value only registers a spike when both the sentiment is leaning towards one side and discussions are ramping up on these platforms.
Here is a chart that shows the trend in the Bitcoin Weighted Sentiment over the last few months:
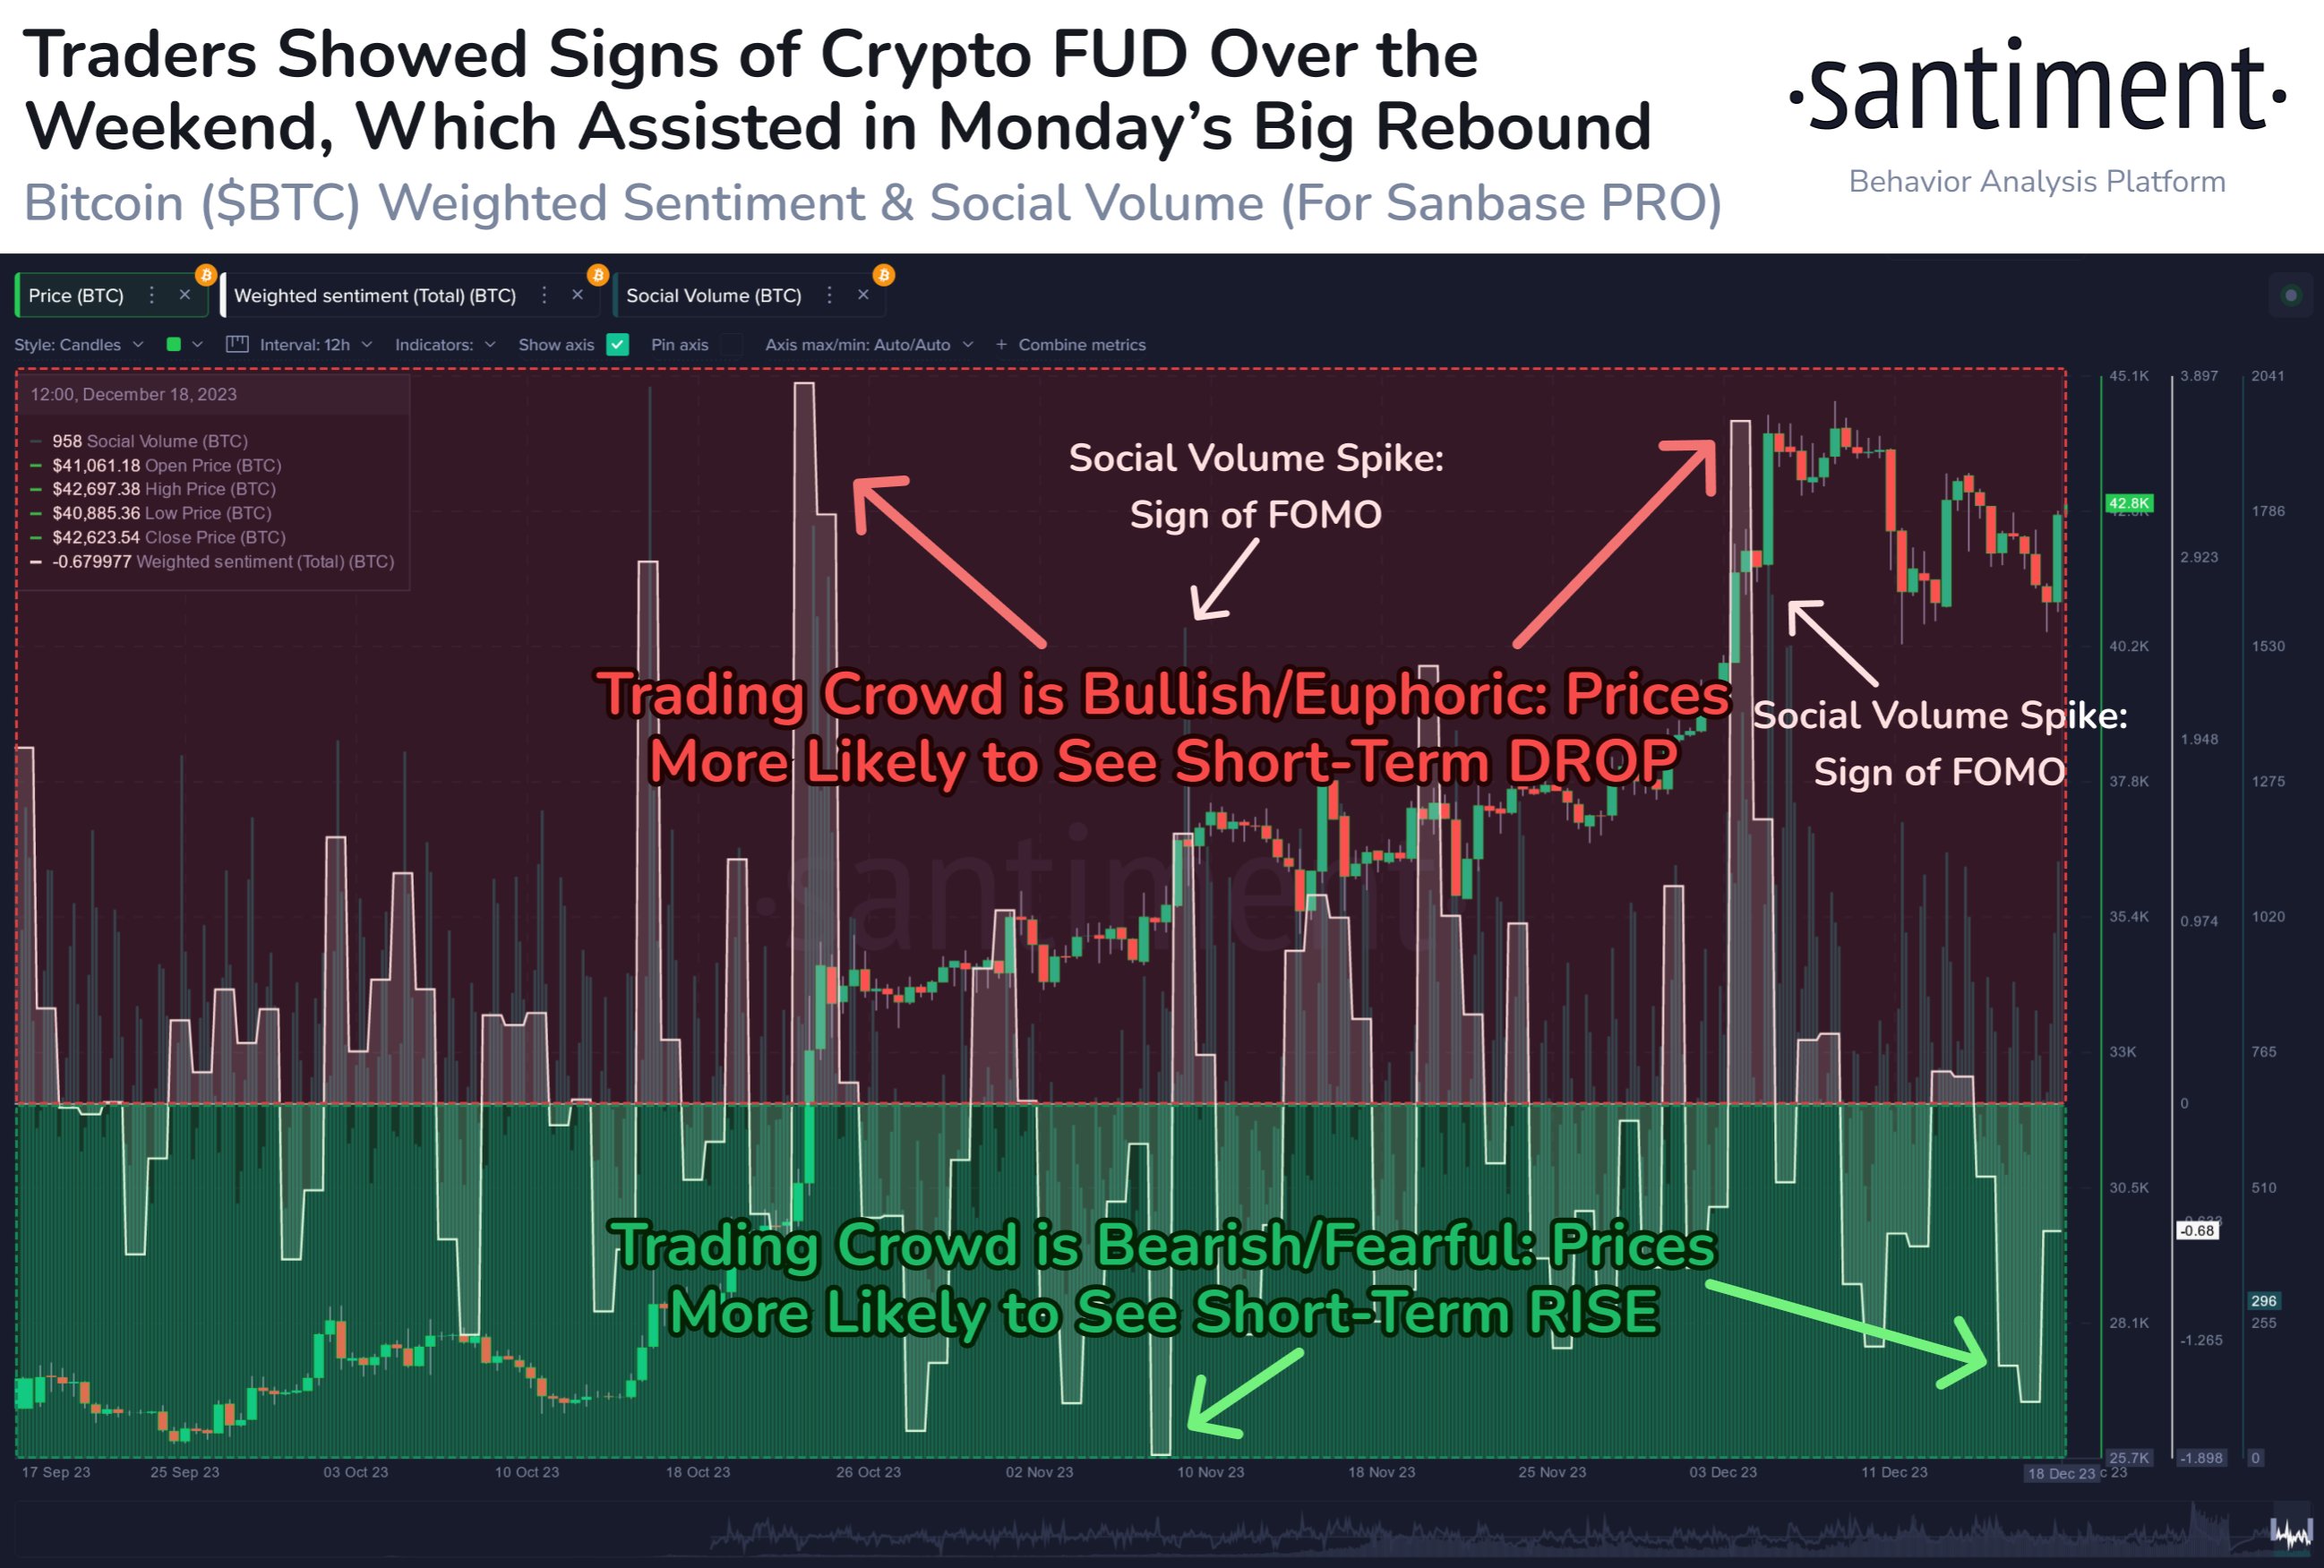
The value of the metric appears to have been quite negative in recent days | Source: Santiment on X
Historically, the Bitcoin price has tended to move against the expectations of the crowd. From the graph, it’s apparent that tops have coincided with the Weighted Sentiment registering highly positive values (that is when FOMO surges among the traders).
Similarly, the indicator observing highly negative spikes is when bottoms have formed. As is visible in the chart, FUD had taken over the minds of the investors after the recent slump in the asset, as the Weighted Sentiment had plunged.
It would appear that, once again, the cryptocurrency’s price has thrived off fear among the investors, as it has recovered contrary to the sentiment held by the majority.
Featured image from André François McKenzie on Unsplash.com, charts from TradingView.com, Santiment.net


